Week 14 Part B- Analyzing Facebook Data
Before even looking at the data, I can tell you that maintaining a strong social media presence is challenging. Half of my battle is in generating ideas to create relevant content on social media, and the other half is in presenting my ideas in a way that engages users. Sometimes the strategy sounds simple and formulaic: understand as much as you can about the audience and reach out to them digitally during the days and times when they are online. Of course! Then again...capturing the attention of a user when they are swimming in videos, quotes, ads, pictures, and testimonials can feel a long way off. That is when data and analytics come to our aid. Sifting through information and noticing patterns to make logic-based conclusions...don't mind if I do!
Rad Math Tutoring
During the time this class assignment was given, I did not have a large enough following on Facebook to get detailed data. It was probably due to the fact that I didn't have a large number of posts or of engaging posts at that. I did want to spend some time on what I did learn about marketing Rad Math Tutoring before I explore the more detailed analytics of another business--Aztec Brewing. The most popular post in terms of engagement and reach was from October. The focus of this assignment is supposed to be aimed on the past month, but this business page hasn't been up for very long and didn't have much traffic in November. The levels of reach and engagement were much higher than any other posts by more than triple the numbers (see image below). The post asked users who their favorite math teacher was and encouraged them to share what made that teacher special in the comments section. To kick off the post, I shared about one of my favorite teachers in high school. I think the post was most successful because it was personal and positive. Also, assuming most students can think of at least one good teacher, the post should have created happy, nostalgic feelings.

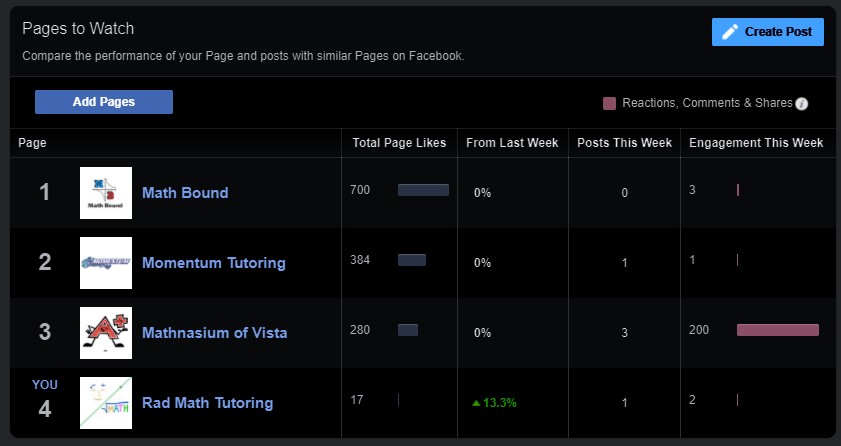
I hardly found any information about users on the Rad Math Tutoring page when I browsed through Insights, other than if the users are on desktops or mobile devices. That must be where my lack of "likes" limits me. However, I did find a great feature that lets me keep tabs on my competitors, or colleagues, depending on your point of view. I can compare my performance online to what is going on with other businesses in the same field. I chose three other math tutoring companies. Mathnasium of Vista had the most posts and engagement that week. They are part of a chain, so they may have more resources to dedicate to social media. As part of the feature on Insights, I was able to easily view the Mathnasium posts of the week. I was curious about what they were doing well and what I could learn from them. Right now, Mathnasium of Vista is offering their tutoring services as a holiday gift you can give to your child or a general friend. I think it's a powerful strategy that reaches parents on an emotional level. I couldn't say how many tutoring appointments people are gifting, but they are taking the first step and clicking on the link.
Aztec Brewing
Let's begin in the "fan" information section since I wasn't able to access that for Rad Math Tutoring. I'm surprised that the fans of Aztec Brewing are online seven days a week with pretty consistent numbers. Monday to Wednesday is a little higher, but only by about a hundred people. There are also a consistent number of fans online from 9 am to 9 pm, but there is a discernable peak after 6 pm. With that information, I would generally post around 3 pm or after. Looking at the post history from September to November, Aztec Brewing is already making posts live in the afternoon or evening. The people who are seeing the page are finding it organically. From my tiny fictional business, a number in the hundreds for one post sounds impressive. Does the company have a goal on how many users they want to reach per post? Are these views and engagement level tied with sales? Unfortunately, that information isn't on Facebook Insights.
Since Aztec brewing is a business in a different field than my fictional education business, I wanted to know what kind of posts were driving users in the craft beer industry. A friend of mine was heavily into the North County beer scene and some of that energy and curiosity stayed with me. Not to mention that there's also a sense of North County pride when it comes to breweries. Unsurprisingly, posts that describe new releases or closures get hundreds of views. However, I don't know why some beer posts get more attention than others. Do the number of views and engagement tie in with the beer preferences of the users? The post about Aztec IPA had much more engagement that the Macaroon Nut Brown. I can't tell if the Aztec fans are hop heads or if there are other factors at play (post time, excitement surrounding a new release, etc.).
Speaking of the Macaroon Nut Brown, I am very excited to see this beer promoted a few times in slightly varied ways. This was a strategy presented in our class textbook, and I appreciate that I can see a real business employ it. The same photo is used and the posts went live around similar times of day (but different days of the week on 9/12 and 11/22). One post seemed more informative, mentioning multiple beers in stock. The other post focused solely on the Macaroon Nut Brown, but included a few emojis. This post had more engagement, and if the difference in results was really just the emojis, I will be 🤯. Overall, this was a pretty interesting assignment to try to piece together.

Comments
Post a Comment